WBTrading Labs

WB Trading Labs / Research / Options before earnings

Does buying options before earnings pay? Across 459 US earnings reports, a call lost 42.8% on average at real prices

A call bought before a US earnings report lost 42.8% of what was paid, on average. Its strike sat as far above the share price as the move the stock's own options priced in. In my test, each call is bought at the ask at the close before the report and sold at the bid at the next close.

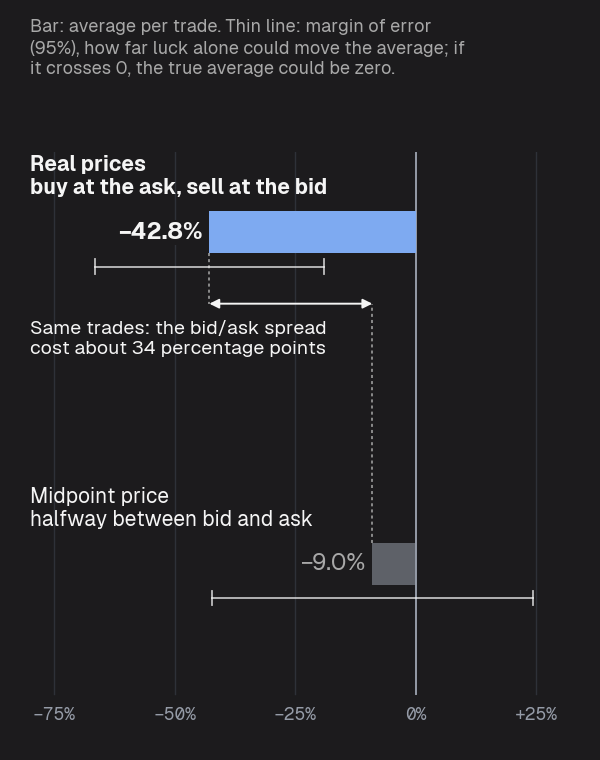
Most of that loss is the bid/ask spread, the gap between the price sellers want (the ask) and the price buyers offer (the bid). Priced halfway between the two, the same trades lost 9.0%, too little to tell apart from no loss at all. A buyer can't count on that midpoint, though: you pay the ask and get the bid unless someone takes your limit price.

It's one earnings season, mostly volatile stocks. The margin of error for the main result runs from −66.6% to −19.1%: a loss even at the ends of that range.

How this study happened

Before an earnings report, a stock's options already put a number on the move: a call and a put at the share price cost, together, about as much as the move the market expects. I wanted to know what someone who bought a call before the report actually got back.

I wrote the rules down first, then ran them on every US report in my own record of option prices, from late June to early October 2026.

Wojciech, 12 October 2026
The findings at a glance

−42.8%

average per trade: a call with its strike as far above the share price as the move its options priced in, bought before the report and sold at the next close, at real prices, 459 US earnings reports. Margin of error −66.6% to −19.1%

−9.0%

the same trades at the midpoint price, halfway between bid and ask: too little to tell apart from no loss at all. Most of the loss is the spread

17%

of the 459 calls made money. The median trade: −90%

34%

of the calls found no buyer at the close after the report: everything paid was lost

Claims and verdicts

Three claims and what the data says

Every claim from every study, in one list →

Claim testedFindingVerdict
Buying a call before a US earnings report and selling it at the next close pays−42.8% on average at real prices, 459 reports; margin of error −66.6% to −19.1%. 17% of the calls made moneyDoes not hold
Selling the call in the morning after the report beats holding it to the closeThe main rule (sell when the bid reaches 1.5 times the price paid): −0.7 percentage points (pp) against holding, margin of error −10.3 to +9.0 pp. The other two rules: much the sameNo improvement
Calls on companies that usually beat analysts' profit estimates do better+14.7 pp against the other companies, margin of error −50.7 to +80.1 pp: no difference these trades can show either wayCan't tell yet

1 · The main test

At real prices the call lost 42.8% on average; at the midpoint, 9.0%, a result luck alone could produce.

First, the main test. For each report I worked out the move the stock's own options priced in: what a call and a put at the share price cost together, as a share of the share price. The median was 9.1%. Then I took the call with its strike that far above the share price, on the nearest expiry after the report, bought it at the ask at the last close before the report and sold it at the bid at the first close after it. The ask is the price sellers want; the bid is the price buyers offer.

Stocks that report on the same evening move together, so I average each evening first; a report released the next morning before the open counts with the evening before. 29 evenings had at least three reports, 430 of the 459 reports, and each evening counts the same. Across them the call lost 42.8% of what was paid, on average, with a margin of error from −66.6% to −19.1%, the range luck alone could move the average within. That's a loss even at the ends of that range.

Priced at the midpoint instead, halfway between the bid and the ask, the same trades lost 9.0%. So most of the loss, about 34 percentage points of it, is the spread. A buyer can't count on the midpoint, though: you pay the ask and get the bid unless someone takes your limit price.

Calls bought before US earnings reports lost 42.8% on average at real prices; at the midpoint the same trades lost 9.0%, a result luck alone could produce

Average return per trade on the call: at real prices −42.8% (margin of error −66.6% to −19.1%), at the midpoint price −9.0% (−42.2% to +24.3%). They are the same trades: the gap between them, about 34 percentage points, is what the bid/ask spread cost.
WB Trading Labs · Fig. 1A call with its strike as far above the share price as the move the stock's options priced in. Real prices: bought at the ask at the last close before the report, sold at the bid at the first close after it. Midpoint: halfway between bid and ask, −9.0% with a margin of error from −42.2% to +24.3%. Average of the 29 evenings with at least three reports (430 of the 459 reports), each evening with the same weight; thin line: margin of error (95%). US earnings reports from 24 June to 9 October 2026. Data: my own record of US option prices, my calculations.

The average also hides how lopsided a bought call is: the median trade lost 90%. Fig. 2 shows how all 459 calls ended; a call with no bid at all at the close after the report counts as a total loss.

Of 459 calls bought before US earnings reports, 17% made money and 34% found no buyer after the report

100 squares, each 1% of the 459 calls: 34% (157 calls) found no buyer at the close after the report, a total loss; 49% (224) lost part of the price paid; 17% (76) made money. 2 calls broke even exactly.
WB Trading Labs · Fig. 2All 459 calls of the main test, bought at the ask at the close before the report and sold at the bid at the first close after it. No buyer: no bid at all, counted as −100%. US earnings reports from 24 June to 9 October 2026. Data: my own record of US option prices, my calculations.

2 · Other strikes

Every strike distance lost on average, and the further out, the more.

These are side results: I wrote them down to see the whole curve, and none of them tests anything on its own.

With a loss that size, I wanted to know whether the strike itself was the problem. So I tried other distances on the same reports: the strike at the share price, half the priced move, the whole move, one and a half times it and twice it. And a call with a delta of 0.25, one whose price moves about a quarter of a dollar for each dollar the stock moves; it's a common choice for a call with its strike above the share price.

Every one of these calls lost on average, and the further the strike from the share price, the larger the loss: from −32.8% with the strike at the share price to −64.7% at twice the priced move.

I tried the other side too. A put with its strike the same distance below the share price lost 27.2% on average, but its margin of error reaches +2.0%, so by the rules I wrote down first, these reports can't settle the put either way. A call and a put bought together, which gain on a big move in either direction, lost 41.1%.

Calls bought before US earnings reports lost money on average at every strike distance, and the further out, the more

Average return per trade at real prices by strike: at the share price −32.8% (margin of error −53.2% to −12.3%), half the priced move −37.9% (−56.6% to −19.1%), the priced move −42.8% (−66.6% to −19.1%), 1.5 times the move −60.3% (−82.2% to −38.4%), twice the move −64.7% (−91.8% to −37.6%). At the midpoint: −17.2%, −17.8%, −9.0%, −30.0% and +2.4%.
WB Trading Labs · Fig. 3Strike above the share price, in multiples of the move priced in by the stock's options. Bought at the ask at the close before the report, sold at the bid at the first close after it; average of the evenings with at least three reports. 27% of the calls made money with the strike at the share price, 8% at twice the move. The 0.25-delta call: −43.4%, close to the main test. Each row leaves out the reports with no listed strike close enough to its target, so the rows cover different reports (358 to 465); the row at the share price leaves out stocks whose listed strikes are far apart, so it leans to the most-traded ones. US earnings reports from 24 June to 9 October 2026. Data: my own record of US option prices, my calculations.

3 · Selling in the morning

Selling in the first two hours of the session after the report did no better than holding to the close.

What if you don't wait for the close and sell into the morning move instead? Before looking at the prices, I wrote down three rules: sell when the bid reaches 1.5 times the price paid; sell when the stock reaches the call's strike; or simply sell about half an hour after the open, whatever the price. Once a rule fires, the sale goes through at the bid about 24 minutes later (my morning prices are recorded about every 12 minutes, 15 minutes delayed), and a call whose rule never fired is sold at the last price recorded that morning.

None of them did better than holding to the close. The main rule, 1.5 times the price paid, came out 0.7 percentage points worse than holding, with a margin of error from −10.3 to +9.0 percentage points. My morning record covers about two thirds of the trades, and only the first two hours of the session.

Calls bought before US earnings reports: selling in the morning after the report against holding to the close

SoldAgainst holdingMargin of error
When the bid reaches 1.5 times the price paid (main rule)−0.7 pp−10.3 to +9.0 pp
When the stock reaches the call's strike−0.4 pp−9.8 to +9.1 pp
About half an hour after the open−1.1 pp−10.4 to +8.2 pp
WB Trading Labs · Table 1The same calls and the same purchase price as the main test; only the moment of sale changes. Return when sold in the morning minus return when held to the close, in percentage points (pp), averaged over the 24 evenings with at least three such reports. In bold: the rule I chose as the main one before counting. Margin of error: 95%. Data: my own record of US option prices, saved about every 12 minutes in the first two hours after the open, 15 minutes delayed; my calculations.

4 · Earnings-beat history

Whether a company usually beats its profit estimates made no difference these trades can show.

Some companies beat analysts' profit estimates almost every quarter, and it's tempting to think calls on them do better. So I split the calls by the company's record: a company goes in the first group if its earnings per share beat the estimate in at least 9 of every 10 of its recent reports (its last 10, or all of them if it had fewer), and every other company in the second. Compared evening by evening, calls on the first group came out 14.7 percentage points ahead, but the margin of error runs from −50.7 to +80.1 percentage points. That includes zero by a wide margin, so these trades show no difference either way.

5 · Weekly and monthly options

Weekly and monthly calls both lost.

This is a side observation, not something I set out to test. The rule takes the nearest expiry after the report. For most companies that's the Friday of the same week, a weekly option. Companies without weekly options list only monthly ones, so there the call still had two to four weeks to run. Both kinds lost much the same: weekly calls 41% on average, monthly calls 48% (287 and 172 calls).

What this can't answer

One earnings season, mostly volatile stocks.

This is one stretch of one earnings season, 24 June to 9 October 2026. The stocks were mostly volatile ones: the volatility priced into the calls bought, how big a yearly swing the option prices assume, averaged 99%. Other seasons, calmer stocks and other markets may look different. A loss as large as the main test's shows up clearly with this many reports; the put and the beat-history results don't.

Next comes a separate study of selling options before reports.

Method

How I counted

I post new studies on X first.

Follow @WojciechBernPL